Note
Go to the end to download the full example code
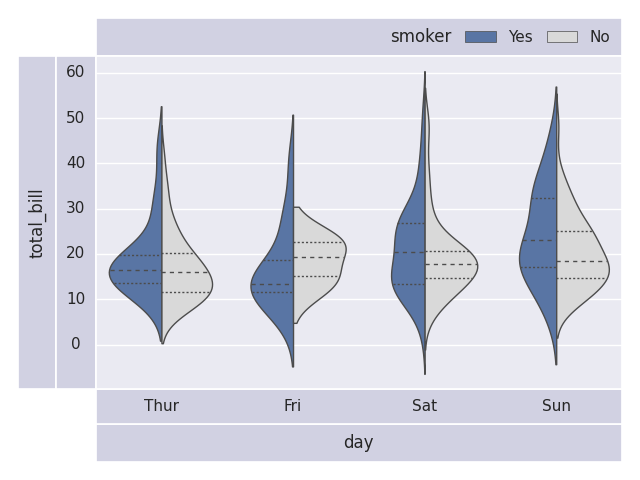
Panel Demo
import pandas as pd
import numpy as np
import matplotlib.pyplot as plt
import matplotlib as mpl
import seaborn as sns

sns.set_theme()

tips = sns.load_dataset("tips")

fig, ax = plt.subplots(1, 1, num=1, clear=True)

# Draw a nested violinplot and split the violins for easier comparison
sns.violinplot(
    data=tips,
    x="day",
    y="total_bill",
    hue="smoker",
    split=True,
    inner="quart",
    linewidth=1,
    palette={"Yes": "b", "No": ".85"},
    ax=ax,
)

from mpl_visual_context.axes_panel import InsetDivider, AxesDivider
from mpl_visual_context.axes_panel import add_panel

divider = InsetDivider(ax)

panels = {
    "y-ticklabels": add_panel(divider, "left", "ticklabels", pad=0.0),
    "y-label": add_panel(divider, "left", "label", pad=0.0),
    "x-ticklabels": add_panel(divider, "bottom", "ticklabels", pad=0.0),
    "x-label": add_panel(divider, "bottom", "label", pad=0.0),
}

legend_panel = add_panel(divider, "top", "empty", pad=0.0)

from mpl_visual_context.legend_helper import (
    extract_offset_boxes_from_legend,
    set_max_length,
)
from matplotlib.offsetbox import HPacker

leg_title, oblist = extract_offset_boxes_from_legend(ax.legend_)
set_max_length(oblist)

pack = HPacker(pad=0.0, sep=10, children=[leg_title] + oblist)

from matplotlib.offsetbox import AnchoredOffsetbox

box = AnchoredOffsetbox("right", child=pack, pad=0, frameon=False)
legend_panel.add_artist(box)
legend_panel.add_to_extent_list(box)

ax.legend_.remove()

import warnings

with warnings.catch_warnings():
    warnings.filterwarnings('ignore', r'This figure includes Axes')
    plt.tight_layout()

plt.show()
Total running time of the script: (0 minutes 0.780 seconds)