Note
Go to the end to download the full example code
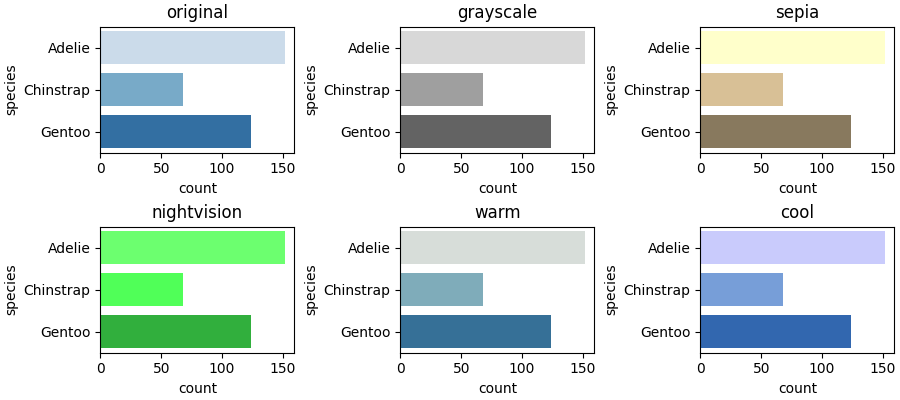
Color Matrix
import matplotlib.pyplot as plt
import seaborn as sns

# sns.color_palette("rocket")

from matplotlib.gridspec import GridSpec
from mpl_visual_context.patheffects import ColorMatrix as CM


def main():
    df_peng = sns.load_dataset("penguins")

    color_matrix = CM.color_matrix

    pe_list = [("original", [])] + [(k, [CM(k)]) for k in color_matrix]

    nn = len(pe_list)
    ncol = 3
    nrow = (nn - 1) // ncol + 1

    fig = plt.figure(figsize=(3 * ncol, 2 * nrow), layout="constrained")
    gs = GridSpec(nrow, ncol, figure=fig)

    for gs1, (k, pe) in zip(gs, pe_list):
        ax = fig.add_subplot(gs1)

        sns.countplot(y="species", data=df_peng, ax=ax, palette="Blues")
        ax.set_title(k)

        for p in ax.patches:
            p.set_path_effects(pe)

    plt.show()


if __name__ == '__main__':
    main()
Total running time of the script: (0 minutes 2.505 seconds)