Note
Go to the end to download the full example code
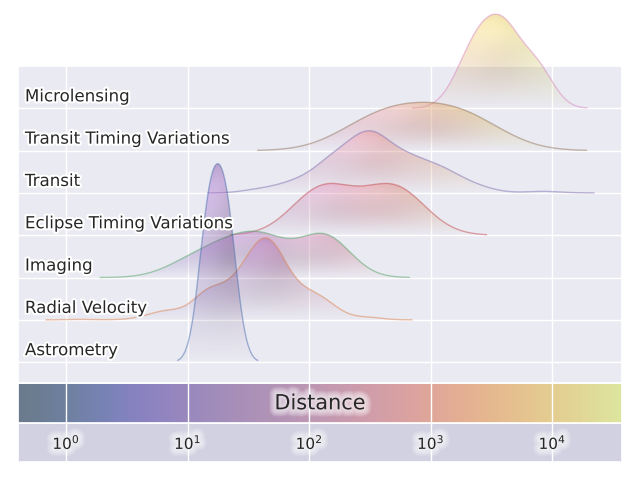
Planet Demo
/home/docs/checkouts/readthedocs.org/user_builds/mpl-visual-context/envs/0.9.2/lib/python3.10/site-packages/seaborn/_oldcore.py:1498: FutureWarning: is_categorical_dtype is deprecated and will be removed in a future version. Use isinstance(dtype, CategoricalDtype) instead
  if pd.api.types.is_categorical_dtype(vector):
/home/docs/checkouts/readthedocs.org/user_builds/mpl-visual-context/envs/0.9.2/lib/python3.10/site-packages/seaborn/_oldcore.py:1119: FutureWarning: use_inf_as_na option is deprecated and will be removed in a future version. Convert inf values to NaN before operating instead.
  with pd.option_context('mode.use_inf_as_na', True):
import numpy as np
import matplotlib.pyplot as plt
import seaborn as sns
import cmocean as cmo

sns.set_theme()
cmap = "cmo.thermal"
# cmap = "Wistia"

# Load the example planets dataset
skip_method = [
    'Pulsation Timing Variations',
    'Pulsar Timing',
    'Orbital Brightness Modulation',
]

planets = sns.load_dataset("planets").query(f"method not in {skip_method}")

fig, ax = plt.subplots(1, 1, num=1, clear=True)

k = planets.groupby("method")["distance"].mean().sort_values()
ind = k.dropna().index.values

sns.kdeplot(
    planets,
    x="distance",
    hue="method",
    hue_order=ind,
    ax=ax,
    fill=True,
    common_norm=False,
    log_scale=True,
)

from mpl_visual_context.spreader import spready

polys = ax.collections[::-1]
dy = 0.7

yindices = np.arange(len(ind))
yoffsets = spready(polys, yindices, dy=dy)

ax.set_ylim(min(yoffsets) - 0.5 * dy, max(yoffsets) + dy)

ax.set_yticks(yoffsets)
ax.tick_params(labelleft=False)
ax.yaxis.label.set_visible(False)
ax.xaxis.label.set(size=15, text="Distance")

import mpl_visual_context.patheffects as pe
import mpl_visual_context.image_effect as ie

tick_glow = pe.StrokeColor("w") | pe.Glow(alpha_line=1)
ax.xaxis.label.set_path_effects([tick_glow, pe.FillOnly()])

for l, o in zip(ind, yoffsets):
    t = ax.annotate(
        l,
        (0, o),
        # fontfamily="cursive",
        fontsize=12,
        xycoords=("axes fraction", "data"),
        xytext=(5, 5),
        textcoords="offset points",
        zorder=10,
    )
    t.set_path_effects([pe.GCModify(linewidth=3) | pe.StrokeColor("w"), pe.FillOnly()])

ax.legend_.remove()

from mpl_visual_context.axes_panel import PanelMaker

pm = PanelMaker(ax)
panels = {}
panels["bl"] = pm.add_panel("bottom", "label")
panels["btl"] = pm.add_panel("bottom", "ticklabels")

panels["bl"].grid(True)
panels["btl"].grid(True)

panels["btl"].annotation_set(path_effects=[tick_glow, pe.FillOnly()])

from mpl_visual_context.image_box import ImageBox

bbox_image = ImageBox(
    "right", alpha=0.5, extent=[0, 0, 1, 1], coords="axes fraction", cmap=cmap
)

panels["bl"].add_artist(bbox_image)

for p in polys:
    bbox_image = ImageBox(
        "right",
        alpha="0. ^ 0.5",
        extent=[0, 0, 1, 1],
        coords=("axes fraction", p),
        cmap=cmap,
    )
    pel = [
        pe.FillImage(bbox_image, ax=ax, clip_box=None)
        | pe.ImageEffect(
            ie.Pad(10)
            | ie.LightSource(
                erosion_size=10, gaussian_size=20, azdeg=200, blend_mode="soft"
            )
        ),
        pe.GCModify(alpha=0.5) | pe.Partial(0.5, 1.0) | pe.Open() | pe.StrokeOnly(),
    ]
    p.set_path_effects(pel)
    p.set_zorder(p.get_zorder() + 3)

    # to prevent the patch being clipped by axes.
    p.set_clip_on(False)

# to suppress the warning
import warnings

with warnings.catch_warnings():
    warnings.filterwarnings('ignore', r'This figure includes Axes')
    plt.tight_layout(rect=[0, 0, 1, 0.9])

plt.show()
Total running time of the script: (0 minutes 2.442 seconds)