Note
Go to the end to download the full example code
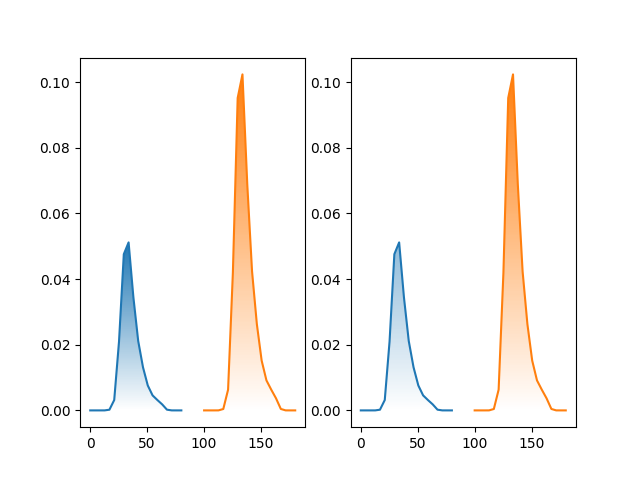
Simple Graient examples
import numpy as np
import matplotlib.pyplot as plt
import matplotlib.colors as mcolors

from mpl_visual_context.patheffects import (
    AlphaGradient,
    FillColorFromStrokeColor,
    StrokeOnly,
)

# data from# seaborn's tips dataset.
y = np.array(
    [
        4.65879889e-18,
        5.49446813e-13,
        4.85455744e-09,
        3.30713828e-06,
        2.11712017e-04,
        3.15587518e-03,
        2.09906863e-02,
        4.75797322e-02,
        5.11671270e-02,
        3.44549129e-02,
        2.11689635e-02,
        1.31456314e-02,
        7.58933885e-03,
        4.57145642e-03,
        3.15988371e-03,
        1.83585312e-03,
        2.19729282e-04,
        3.18660472e-06,
        4.24242960e-09,
        4.48842177e-13,
    ]
)

x = np.linspace(0, 80, len(y))


def plot_ax(ax, x, y):
    (l1,) = ax.plot(x, y)
    (l2,) = ax.plot(x + 100, 2 * y)

    return l1, l2


if True:

    fig, axs = plt.subplots(1, 2, num=1, clear=True)

    l1, l2 = plot_ax(axs[0], x, y)

    pe = [FillColorFromStrokeColor() | AlphaGradient("up"), StrokeOnly()]
    l1.set_path_effects(pe)
    l2.set_path_effects(pe)

    l1, l2 = plot_ax(axs[1], x, y)

    pe = [
        FillColorFromStrokeColor() | AlphaGradient("up", coords=[l1, l2]),
        StrokeOnly(),
    ]
    l1.set_path_effects(pe)
    l2.set_path_effects(pe)

    plt.show()
Total running time of the script: (0 minutes 0.172 seconds)