PathEffect User Guide
mpl-visual-context.patheffects module provides a collection of PathEffects. They can be used to change the path-property of the artist on the drawing time.
Composable PathEffects
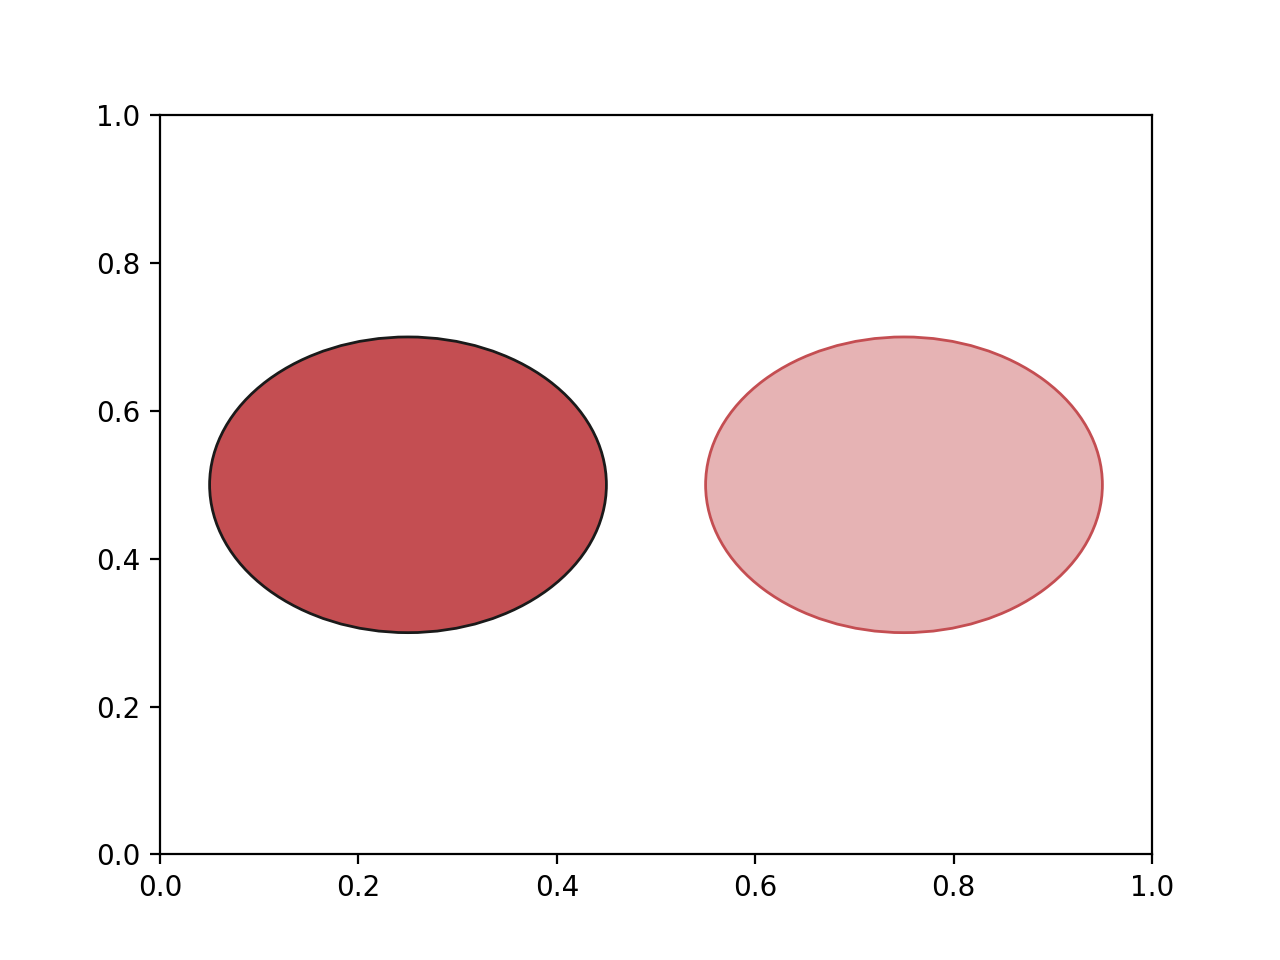
We provide PatheEffects that can be pipelined to create custom effects. For example,
import matplotlib.pyplot as plt
from mpl_visual_context.patheffects import (HLSModify,
                                            StrokeColorFromFillColor,
                                            FillOnly, StrokeOnly)

fig, ax = plt.subplots()

# original
p1 = plt.Circle((0.25, 0.5), 0.2, fc="r", ec="k")
ax.add_patch(p1)

# w/ patheffects
p2 = plt.Circle((0.75, 0.5), 0.2, fc="r", ec="k")
ax.add_patch(p2)

# set the color lightness to 0.8 and draw with fill-only (no stroke)
pe_fill = HLSModify(l=0.8) | FillOnly()
# set the stroke color to original fill color and stroke (no fill)
pe_stroke = StrokeColorFromFillColor() | StrokeOnly()

p2.set_path_effects([pe_fill, pe_stroke])

plt.show()
(Source code, png, hires.png, pdf)

The PathEffects inherit from ChainablePathEffect can be pipelined using a | operator to make a custom patheffects.
Here is the list.
Color-related
PathEffect which modifies the color in HLS space. |
|
PathEffect which modifies the color in HLS space. |
|
PathEffect which modifies the color in RGB space, using a predefined color matrix. |
|
PathEffect to set the fill color |
|
PathEffect to set the fill color by the stroke color |
|
PathEffect to set the stoke color |
|
PathEffect to set the stoke color by the fill color |
Path-related
PathEffect with only stroke. |
|
PathEffect with only fill. |
|
PathEffect with no closed with. |
|
PathEffect with that preserve only a part of the path. |
|
PathEffect that transform the given lines to smooth bezier path. |
|
PathEffect that transform a patch created by fill_between to a smooth nezier path. |
Clip-related
PathEffect that clips the path using a provided patch. |
|
PathEffect that sets the clip_path to the path itself. |
|
PathEffect that modifies the clip_rect using the given coordinate (and transform). |
Tranform-related
PathEffect that offsets the path. |
Multiple Strokes
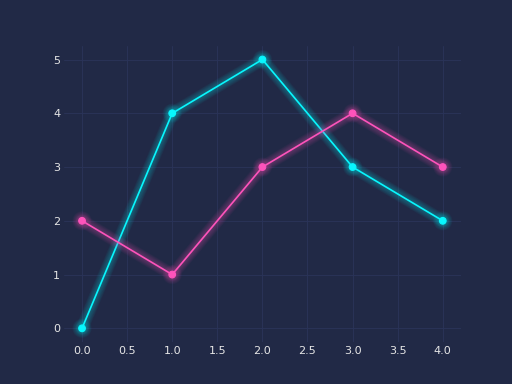
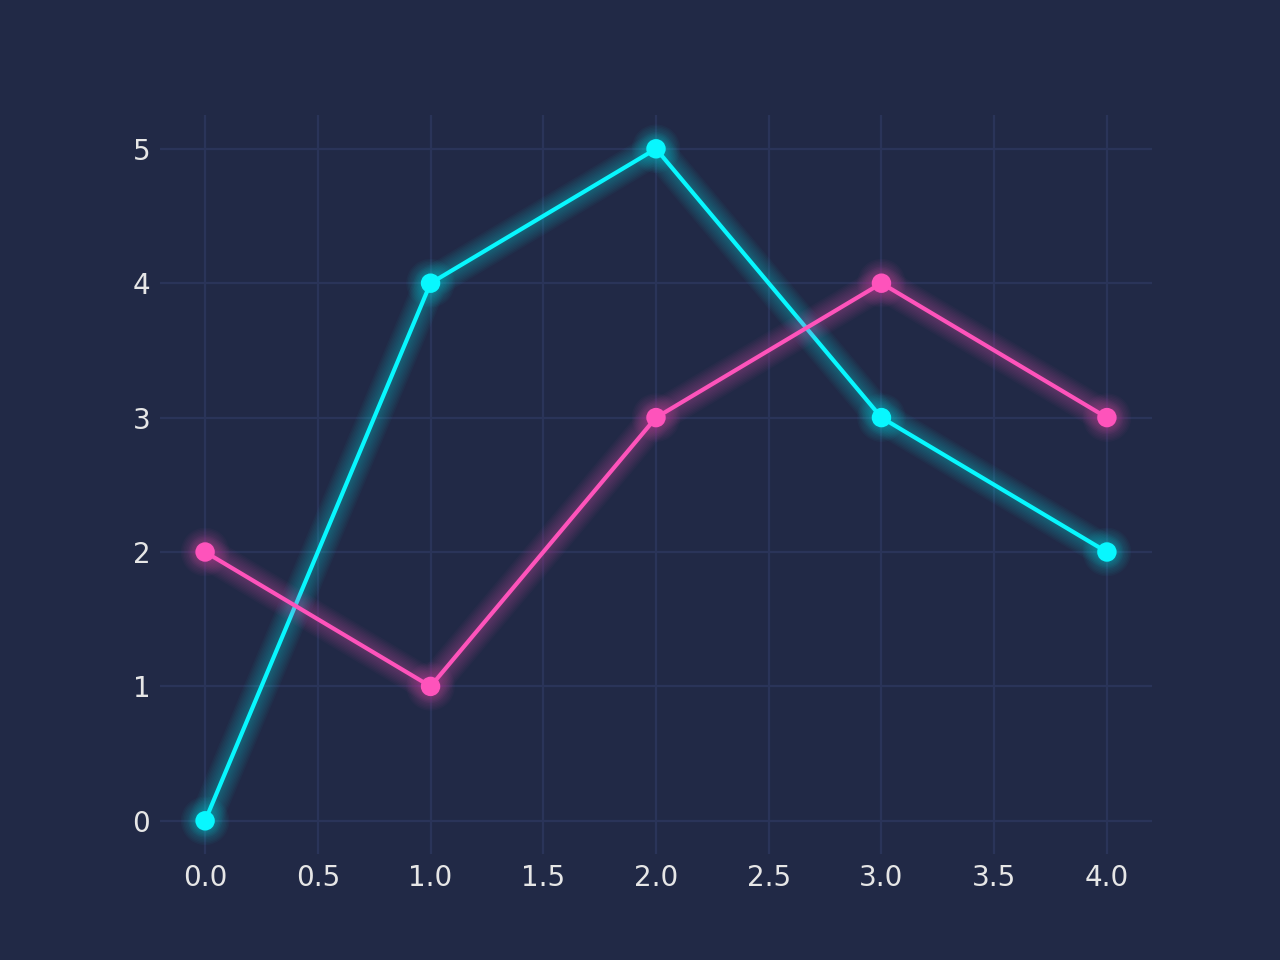
Some path effects stokes multiple lines with different styles. This is motivated by cybepunk style.
import matplotlib.pyplot as plt
import mplcyberpunk
plt.style.use("cyberpunk") # just to change the background and colors
from matplotlib.patheffects import Normal
from mpl_visual_context.patheffects import Glow

fig, ax = plt.subplots()

l1, = ax.plot([0, 4, 5, 3, 2], "o-")
l2, = ax.plot([2, 1, 3, 4, 3], "o-")

glow = [Glow(), Normal()]
for l in [l1, l2]:
    l.set_path_effects(glow)

plt.show()
(Source code, png, hires.png, pdf)

multiple stokes
Patheffect with glow effect. |
|
Patheffect similar to Glow, but with different colors basedon the given colormap. |
ImageBox PathEffect
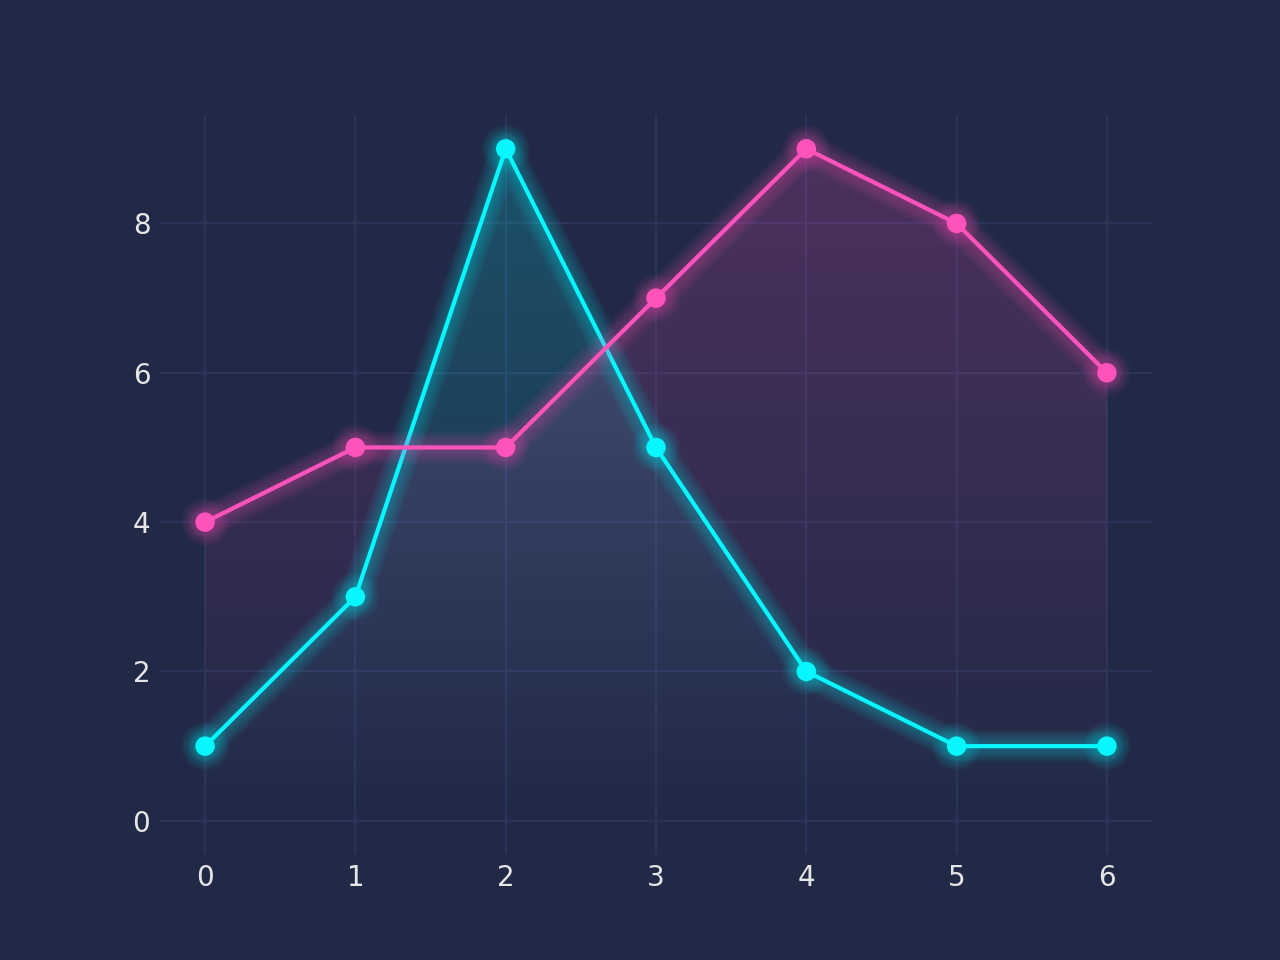
We provide PathEffect that actually draws images (not path), most notable example is to provide a gradient effect.
ImageBox is a moudule to create a gradient image.
import matplotlib.pyplot as plt
import mplcyberpunk
plt.style.use("cyberpunk") # just to change the background and colors
from matplotlib.patheffects import Normal
from mpl_visual_context.patheffects import Glow, AlphaGradient

fig, ax = plt.subplots()

x = range(7)
y1 = [1, 3, 9, 5, 2, 1, 1]
y2 = [4, 5, 5, 7, 9, 8, 6]

l1, = ax.plot(x, y1, marker='o')
l2, = ax.plot(x, y2, marker='o')

p1 = ax.fill_between(x, y1, alpha=0.2)
p2 = ax.fill_between(x, y2, alpha=0.2)

glow = [
    Glow(),
    Normal()
]
for l in [l1, l2]:
    l.set_path_effects(glow)

glow_fill = [AlphaGradient("up")]
for p in [p1, p2]:
    p.set_path_effects(glow_fill)

plt.show()
(Source code, png, hires.png, pdf)

Fill the path with image of the fill color of the path, with varying transparency. |
|
Methods |
|
Fill the path with the given image. |
ImageEffect
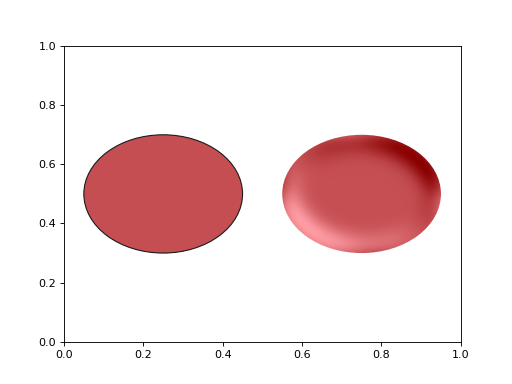
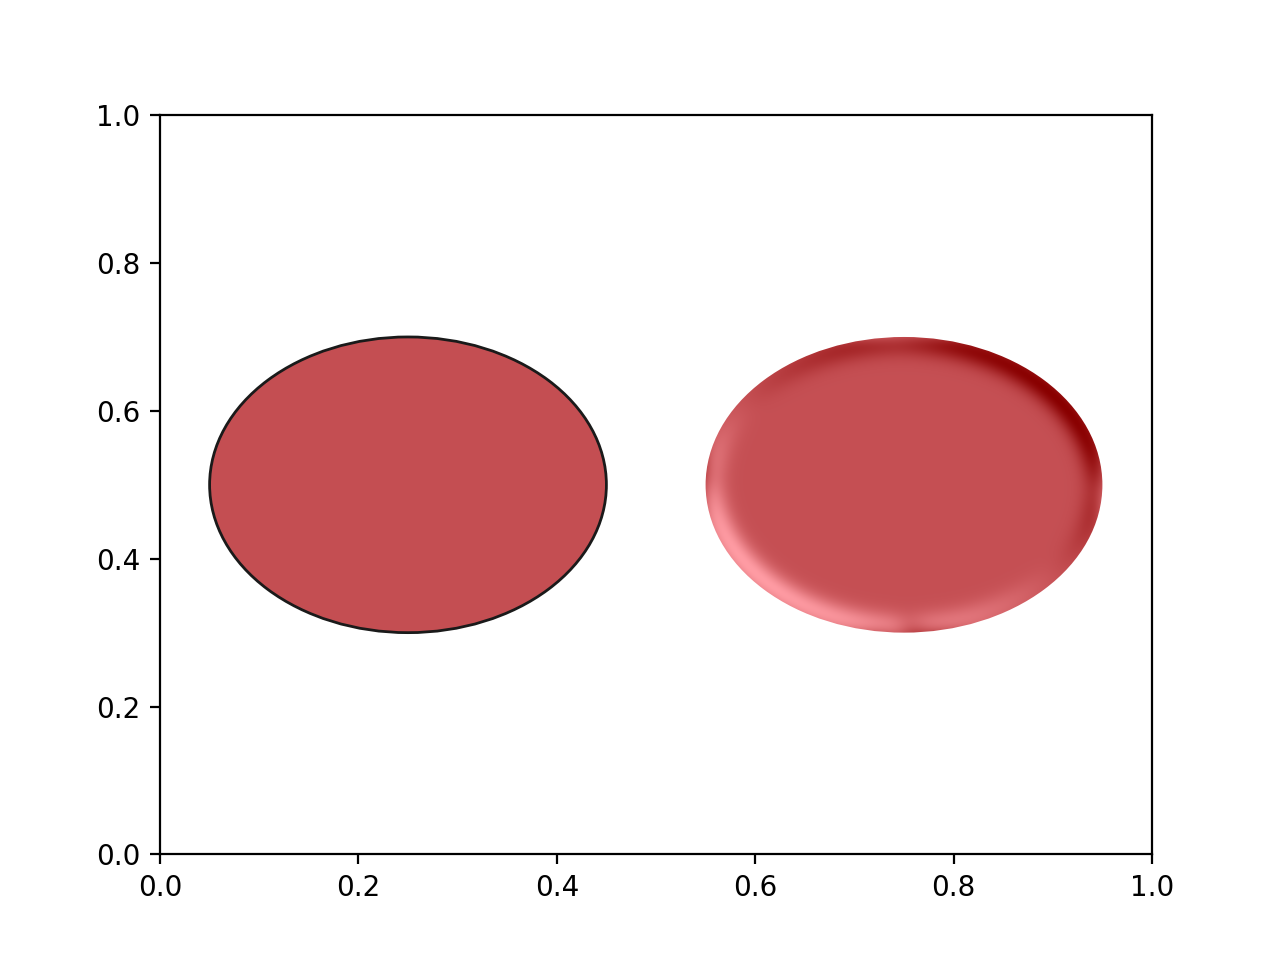
The ImageEffect is very special. It is a patheffect version of MPL’s agg filter. It will render the artist (w/ path effects in the pipeline) as an image (using the Agg backend), apply image processing (e.g., GaussianBlur), then place the image at the canvas.
It can be pipelines, but should be at the end of the pipeline. It can be placed even after other non-chainable PathEffects.
import matplotlib.pyplot as plt
from mpl_visual_context.patheffects import FillOnly, ImageEffect
from mpl_visual_context.image_effect import LightSource


fig, ax = plt.subplots()

# original
p1 = plt.Circle((0.25, 0.5), 0.2, fc="r", ec="k")
ax.add_patch(p1)

# w/ patheffects
p2 = plt.Circle((0.75, 0.5), 0.2, fc="r", ec="k")
ax.add_patch(p2)

p2.set_path_effects([FillOnly() | ImageEffect(LightSource(erosion_size=10,
                                                          gaussian_size=10))])

plt.show()
(Source code, png, hires.png, pdf)

Methods |