Note
Go to the end to download the full example code.
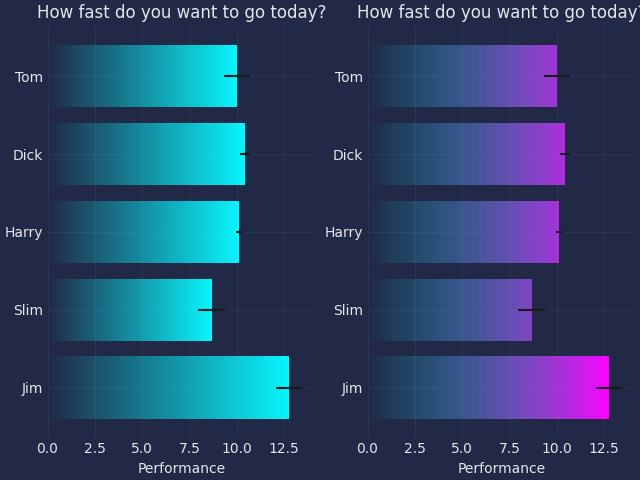
Horizontal bar chart w/ Gradient
This example is based on barh.py example from matplotlib.
import matplotlib.pyplot as plt
import numpy as np

# import seaborn as sns
# sns.set_theme()
import mplcyberpunk

plt.style.use("cyberpunk")

# Fixing random state for reproducibility
np.random.seed(19680801)

fig, axs = plt.subplots(1, 2, num=1, clear=True, layout="constrained")

# Example data
people = ('Tom', 'Dick', 'Harry', 'Slim', 'Jim')
y_pos = np.arange(len(people))
performance = 3 + 10 * np.random.rand(len(people))
error = np.random.rand(len(people))


def draw_ax(ax):
    bars = ax.barh(y_pos, performance, xerr=error, align='center')
    ax.set_yticks(y_pos, labels=people)
    ax.invert_yaxis()  # labels read top-to-bottom
    ax.set_xlabel('Performance')
    ax.set_title('How fast do you want to go today?')

    return bars


from mpl_visual_context.patheffects import FillImage, AlphaGradient
from mpl_visual_context.image_box import ImageBox

ax = axs[0]
bars = draw_ax(ax)
pe = [AlphaGradient("right")]

for p in bars:
    p.set_path_effects(pe)

ax = axs[1]
bars = draw_ax(ax)

bbox_image = ImageBox("right", alpha="right", extent=[0, 0, 1.0, 1], coords=bars)

pe = [FillImage(bbox_image, ax=ax)]

for p in bars:
    p.set_path_effects(pe)

plt.show()
Total running time of the script: (0 minutes 0.207 seconds)