Note
Go to the end to download the full example code
ImageBox exmaples
import matplotlib.pyplot as plt
import numpy as np
from mpl_visual_context.image_box import ImageBox, ColorBox
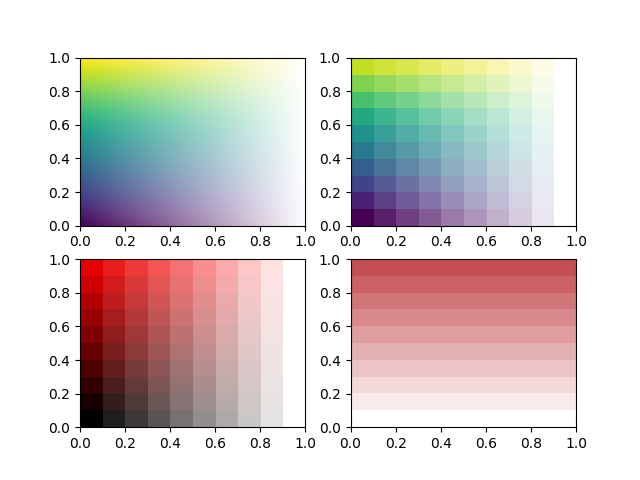
def plot_gradient():
fig, axs_ = plt.subplots(2, 2, num=1, clear=True)
axs = axs_.flat
ib = ImageBox("up", alpha="left", extent=(0, 0, 1, 1), coords="data")
axs[0].add_artist(ib)
z = np.arange(100).reshape((10, 10))
ib = ImageBox(z, alpha="left", extent=(0, 0, 1, 1), coords="data")
axs[1].add_artist(ib)
z = np.zeros((10, 10, 3))
z[:, :, 0] = np.arange(100).reshape((10, 10)) / 100.0
ib = ImageBox(z, alpha="left", extent=(0, 0, 1, 1), coords="data")
axs[2].add_artist(ib)
ib = ColorBox("r", alpha="up", shape=(10, 10), extent=(0, 0, 1, 1), coords="data")
axs[3].add_artist(ib)
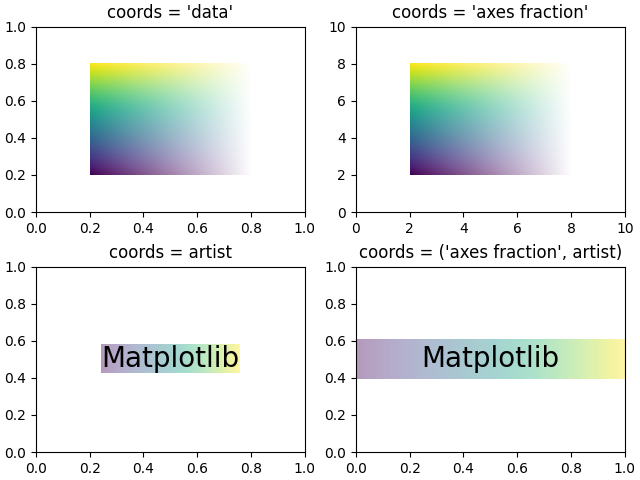
def plot_extent():
fig, axs_ = plt.subplots(2, 2, num=2, clear=True, layout="constrained")
axs = axs_.flat
ax = axs[0]
ib = ImageBox("up", alpha="left", extent=(0.2, 0.2, 0.8, 0.8), coords="data")
ax.add_artist(ib)
ax.set_title("coords = 'data'")
ax = axs[1]
ib = ImageBox(
"up", alpha="left", extent=(0.2, 0.2, 0.8, 0.8), coords="axes fraction"
)
ax.add_artist(ib)
ax.set(xlim=(0, 10), ylim=(0, 10))
ax.set_title("coords = 'axes fraction'")
ax = axs[2]
a = ax.annotate("Matplotlib", (0.5, 0.5), va="center", ha="center", fontsize=20)
ib = ImageBox("right", alpha=0.4, extent=(0, 0, 1, 1), coords=a)
ax.add_artist(ib)
ax.set_title("coords = artist")
ax = axs[3]
a = ax.annotate("Matplotlib", (0.5, 0.5), va="center", ha="center", fontsize=20)
ib = ImageBox(
"right",
alpha=0.4,
extent=(0, 0.0 - 0.2, 1, 1.0 + 0.2),
coords=("axes fraction", a),
)
ax.set_title("coords = ('axes fraction', artist)")
ax.add_artist(ib)
if __name__ == '__main__':
plot_gradient()
plot_extent()
plt.show()
Total running time of the script: (0 minutes 0.727 seconds)