Note
Go to the end to download the full example code
Simple Panel
import matplotlib.pyplot as plt
from mpl_visual_context.axes_panel import PanelMaker
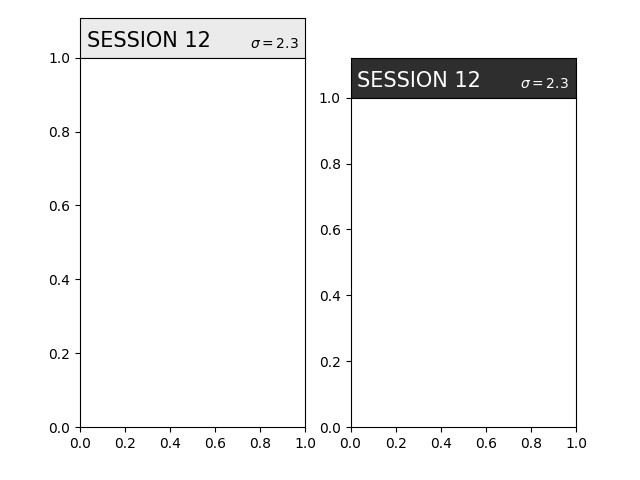
fig, axs = plt.subplots(1, 2, num=1, clear=True)
ax = axs[0]
title_panel = PanelMaker(ax).add_panel("top", "empty", pad=0.0)
title_panel.anchor("SESSION 12", loc="lower left", size=15, borderpad=0.5)
title_panel.anchor(r"$\sigma=2.3$", loc="lower right")
ax = axs[1]
title_panel = PanelMaker(ax, mode="divider").add_panel(
"top", "empty", pad=0.0, axes_kwargs=dict(fc="k")
)
title_panel.anchor("SESSION 12", loc="lower left", color="w", size=15, borderpad=0.5)
title_panel.anchor(r"$\sigma=2.3$", color="w", loc="lower right")
plt.show()
Total running time of the script: (0 minutes 0.460 seconds)