Note
Go to the end to download the full example code
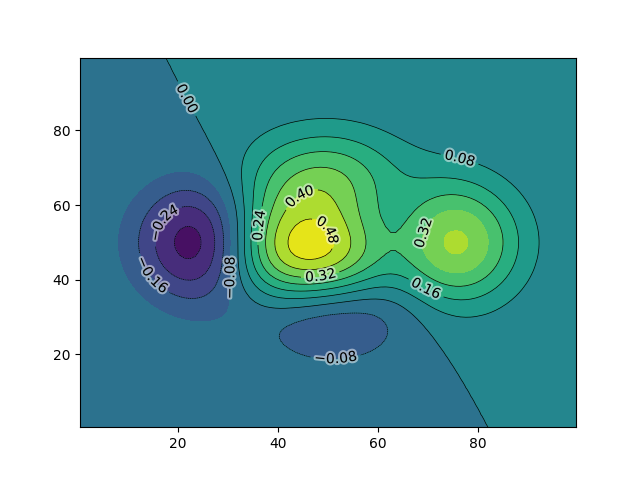
Contour with curved labels
import scipy
import numpy as np
import matplotlib.pyplot as plt
from matplotlib.textpath import TextPath
from matplotlib.patches import PathPatch
from matplotlib.font_manager import FontProperties

def f(x, y):
    return (1 - x / 2 + x ** 5 + y ** 3) * np.exp(-(x ** 2) - y ** 2)

n = 100
x = np.linspace(-3, 3, n)
y = np.linspace(-3, 3, n)
X, Y = np.meshgrid(x, y)
Z = 0.5 * f(X, Y)


fig, ax = plt.subplots(num=1, clear=True)
levels = 10


CF = plt.contourf(Z, origin="lower", levels=levels)
CS = plt.contour(Z, origin="lower", levels=levels, colors="black", linewidths=0.5)

# As we must set inline=False so that LocatorForAnn works. The locator will
# inline the path instead.
ax.clabel(CS, CS.levels, inline=False)

from mpl_visual_context.misc import curved_contour_labels
from mpl_visual_context.patheffects import GCModify, FillOnly

curved_contour_labels(CS,
                      text_patheffects=[GCModify(alpha=0.5, linewidth=3,
                                                 foreground="w"),
                                        FillOnly()])

plt.show()
Total running time of the script: (0 minutes 0.279 seconds)