Note
Go to the end to download the full example code
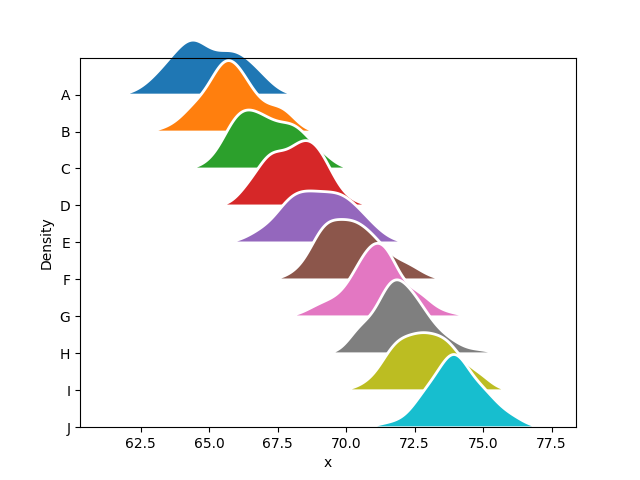
spread example
import pandas as pd
import numpy as np
import matplotlib.pyplot as plt
import matplotlib as mpl
import seaborn as sns

# Create the data : copied from examples/kde_ridgeplot.py
rs = np.random.RandomState(1979)
x = rs.randn(500)
g = np.tile(list("ABCDEFGHIJ"), 50)
df = pd.DataFrame(dict(x=x, g=g))
m = df.g.map(ord)
df["x"] += m


fig, ax = plt.subplots(1, 1, num=1, clear=True)

sns.kdeplot(
    df,
    x="x",
    hue="g",
    ax=ax,
    fill=True,
    linewidth=2,
    clip_on=False,
    ec="w",
    alpha=1,
)

from mpl_visual_context.spreader import spready

polys = ax.collections

dy = 0.5 * max([p.get_datalim(p.axes.transData).height for p in polys])

yindices = np.arange(len(polys))
gg = df["g"].unique()
yoffsets = spready(polys, yindices, dy=dy)

ax.set_ylim(min(yoffsets), max(yoffsets) + dy)
ax.set_yticks(yoffsets, labels=gg[::-1])

ax.legend_.remove()

plt.show()
Total running time of the script: (0 minutes 0.177 seconds)