Note
Go to the end to download the full example code.
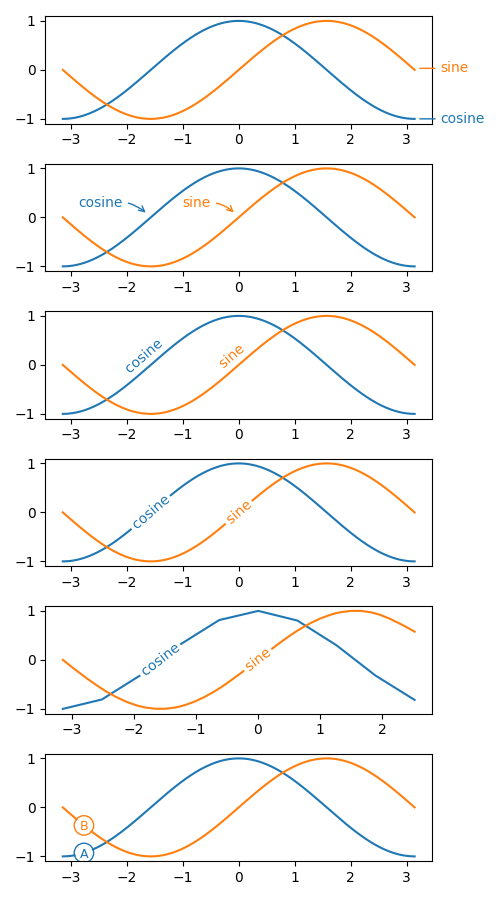
Locator demo
# adopted from an example in Scientific Visulization book.
import numpy as np
import matplotlib.pyplot as plt
import matplotlib.transforms as mtransforms
from matplotlib.patches import Circle
from mpl_visual_context.patheffects import Smooth, Affine
from mpl_visual_context.patheffect_locator import (LocatorForAnn,
                                                   LocatorForIXYAR)
X = np.linspace(-np.pi, np.pi, 400, endpoint=True)
C, S = np.cos(X), np.sin(X)

def plot_demo(ax, sl=slice(None)):

    l1, = ax.plot(X[sl], C[sl], label="cosine", clip_on=False)
    l2, = ax.plot(X[sl], S[sl], label="sine", clip_on=False)

    return l1, l2

def demo_ann_in_axes_coordinate(ax):
    l1, l2 = plot_demo(ax)

    # It is important to set the reasonable initial coordinate, so that layout
    # algorithm like tightlayout works. Behind the scene, the locator will find
    # the coordinate in the screen coordinate the convert it to the coordinate
    # of the text artist. So the coordinate is not important from the locator
    # point of view.
    ann_kwargs = dict(xy=(0.95, 0), xytext=(20, 0),
                      xycoords="axes fraction",
                      textcoords="offset points",
                      va="center", ha="left", # size=15,
                      )
    pe_kwargs = dict(xy=(0.95, None), # in normalized axes coordinate.
                     coords="axes fraction",
                     locate_only=True,
                     split_path=False)

    for l in [l1, l2]:
        t = ax.annotate(l.get_label(), color=l.get_color(),
                        arrowprops=dict(arrowstyle="-", shrinkB=5,
                                        ec=l.get_color()),
                        **ann_kwargs)
        l.set_path_effects([LocatorForAnn(t, ax, **pe_kwargs)])

        # we add invisible text so that tight_layout make room for the above
        # annotation.
        # ax.annotate(l.get_label(), (1, 0.5), xycoords="axes fraction",
        #             ha="left", alpha=0)

def demo_ann_in_data_coordinate(ax):
    l1, l2 = plot_demo(ax)

    ann_kwargs = dict(xy=(0, 0), xytext=(-20, 10),
                      textcoords="offset points",
                      va="center", ha="right", # size=15,
                      in_layout=False
                      )
    pe_kwargs = dict(coords="data",
                     locate_only=True,
                     split_path=False)

    for l, x in zip([l1, l2], [-0.5*np.pi, 0]):
        t = ax.annotate(l.get_label(), color=l.get_color(),
                        arrowprops=dict(arrowstyle="->", shrinkB=5,
                                        ec=l.get_color(),
                                        connectionstyle="arc3,rad=-0.3"),
                        **ann_kwargs)
        l.set_path_effects([LocatorForAnn(t, ax, xy=[x, None], **pe_kwargs)])

def demo_ann_with_angle_and_offset(ax):
    l1, l2 = plot_demo(ax)

    ann_kwargs = dict(xy=(0, 0), xytext=(0, 0),
                      textcoords="offset points",
                      va="center", ha="center", # size=15,
                      in_layout=False
                      )
    pe_kwargs = dict(coords="data",
                     do_rotate=True, do_curve=True,
                     split_path=False)

    for l, x in zip([l1, l2], [-0.5*np.pi, 0]):
        t = ax.annotate(l.get_label(), color=l.get_color(),
                        **ann_kwargs)
        l_pe = LocatorForAnn(t, ax, xy=[x, None], **pe_kwargs)
        l.set_path_effects([l_pe])

        t_pe = l_pe.new_curved_patheffect()
        t.set_path_effects([t_pe | Affine().translate(0, 80)])

def demo_ann_with_path_split_and_curved(ax):
    l1, l2 = plot_demo(ax)

    ann_kwargs = dict(xy=(0, 0), xytext=(0, 0),
                      textcoords="offset points",
                      va="center", ha="center", # size=15,
                      in_layout=False
                      )
    pe_kwargs = dict(coords="data",
                     do_rotate=True, do_curve=True,
                     split_path=True)

    for l, x in zip([l1, l2], [-0.5*np.pi, 0]):
        t = ax.annotate(l.get_label(), color=l.get_color(),
                        **ann_kwargs)
        l_pe = LocatorForAnn(t, ax, xy=[x, None], **pe_kwargs)
        l.set_path_effects([l_pe])

        t_pe = l_pe.new_curved_patheffect()
        t.set_path_effects([t_pe])

def demo_ann_with_path_split_and_curved2(ax):
    # It should also work with any(?) bezier curves

    sl = slice(None, None, 40)
    l1, l2 = plot_demo(ax, sl=sl)

    ann_kwargs = dict(xy=(0, 0), xytext=(0, 0),
                      textcoords="offset points",
                      va="center", ha="center", # size=15,
                      in_layout=False
                      )
    pe_kwargs = dict(coords="data",
                     do_rotate=True, do_curve=True,
                     split_path=True)

    for l, x, s in zip([l1, l2], [-0.5*np.pi, 0], [False, True]):
        t = ax.annotate(l.get_label(), color=l.get_color(),
                        **ann_kwargs)
        l_pe = LocatorForAnn(t, ax, xy=[x, None], **pe_kwargs)
        if s:
            l.set_path_effects([Smooth() | l_pe])
        else:
            l.set_path_effects([l_pe])

        t_pe = l_pe.new_curved_patheffect()
        t.set_path_effects([t_pe])

def demo_custom(ax):
    l1, l2 = plot_demo(ax)

    radius = 7 # radius of the circe in points We won't be rotating the text.
    # But we will set relavant parameters in case we want it to be rotated
    # later.

    pe_kwargs = dict(coords="axes fraction", pad=radius,
                     do_rotate=False,
                     split_path=True)

    for l, c in zip([l1, l2], ["A", "B"]):
        # while we set the radius here, we want the radius in points thus it
        # needs to be reset at drawing time.

        # The custom callback function sets in the screen coordinate. So the
        # patch and text should have a IdentityTransform.

        color = l.get_color()
        p = Circle((0, 0), radius, transform=mtransforms.IdentityTransform(),
                   ec=color, fc="none",
                   zorder=3, # zorder should be higher than l
                   in_layout=False)
        ax.add_patch(p)
        t = ax.text(0, 0, c, transform=mtransforms.IdentityTransform(),
                    color=color,
                    ha="center", va="center_baseline",
                    size=radius*1.3,
                    rotation_mode="anchor",
                    in_layout=False)

        def cb_ixyar(i, xy, angle, R, renderer, t=t, p=p):
            dpi_cor = renderer.points_to_pixels(1.)

            if i == -1:
                p.set_visible(False)
                t.set_visible(False)
            elif i == 0:
                p.set_visible(True)
                p.set_center(xy)
                p.set_radius(radius*dpi_cor)
                t.set_visible(True)
                t.set_position(xy)
                t.set_rotation(angle)

        l.set_path_effects([LocatorForIXYAR(cb_ixyar, ax, xy=[0.1, None],
                                            **pe_kwargs)])


def main():
    fig, axs = plt.subplots(6, 1, num=1, clear=True, figsize=(5, 9))

    demo_ann_in_axes_coordinate(axs[0])

    demo_ann_in_data_coordinate(axs[1])

    demo_ann_with_angle_and_offset(axs[2])

    demo_ann_with_path_split_and_curved(axs[3])

    demo_ann_with_path_split_and_curved2(axs[4])

    demo_custom(axs[5])

    fig.tight_layout()
    plt.show()

if __name__ == '__main__':
    main()
Total running time of the script: (0 minutes 0.582 seconds)