Note
Go to the end to download the full example code.
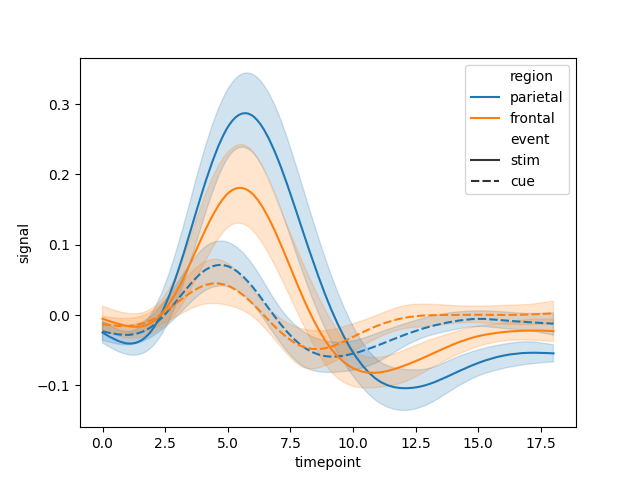
Smooth demo, w/ closed path created by fill_between.
Adopted from seaborn’s errorband_lineplots example
import numpy as np
import numpy as np
from scipy.interpolate import make_interp_spline
import matplotlib.pyplot as plt
# from mpl_visual_context.patheffects import Smooth, StrokeColor, GCModify

from mpl_visual_context.patheffects import Smooth, SmoothFillBetween


import seaborn as sns
# sns.set_theme(style="darkgrid")

# Load an example dataset with long-form data
fmri = sns.load_dataset("fmri")

fig, ax = plt.subplots(num=1, clear=True)
# Plot the responses for different events and regions
sns.lineplot(x="timepoint", y="signal",
             hue="region", style="event",
             data=fmri, ax=ax)

# The code above creates 10 lines. ax.lines[4:] have no data. Not sure what
# they are.
for l in ax.lines[:4]:
    l.set_path_effects([Smooth()])

for col in ax.collections:
    col.set_path_effects([SmoothFillBetween(skip_first_n=1)])

plt.show()
Total running time of the script: (0 minutes 1.315 seconds)