Note
Go to the end to download the full example code.
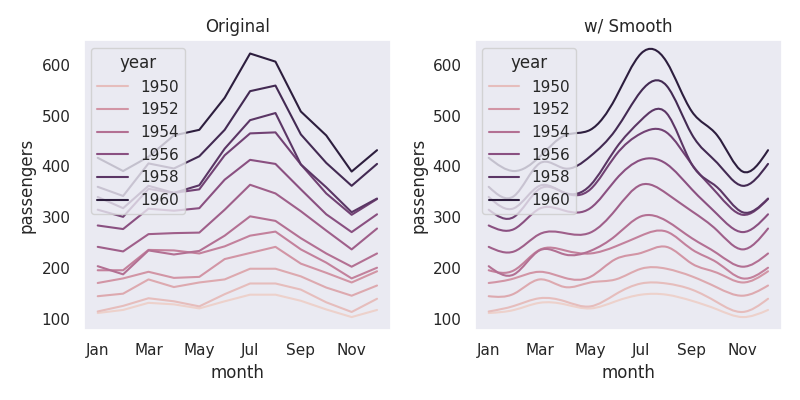
Simple Smooth path
Adopted from seaborn’s timeseries_facets example
import matplotlib.pyplot as plt
import seaborn as sns

sns.set_theme(style="dark")
flights = sns.load_dataset("flights")

fig, axs = plt.subplots(1, 2, figsize=(8, 4))

def myplot(ax):
    sns.lineplot(
        data=flights, x="month", y="passengers", units="year",
        hue="year",
        estimator=None,
        ax=ax
    )
    ax.set_xticks(ax.get_xticks()[::2])

# Original plot
axs[0].set_title("Original")
myplot(axs[0])

# Same plot, but We apply Smooth patheffects to make the lines smooth.
axs[1].set_title("w/ Smooth")
myplot(axs[1])

from mpl_visual_context.patheffects import Smooth

pe_smooth = Smooth()
for l in axs[1].lines:
    l.set_path_effects([pe_smooth])

fig.tight_layout()

plt.show()
Total running time of the script: (0 minutes 0.476 seconds)