Note
Go to the end to download the full example code.
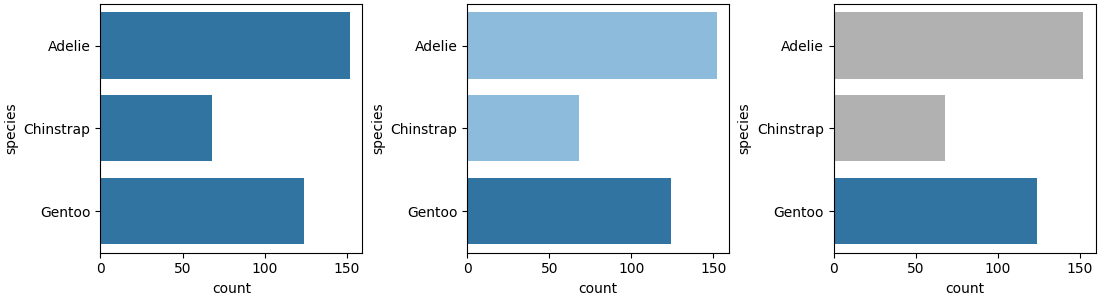
PathEffects Container
import matplotlib.pyplot as plt
import seaborn as sns

from mpl_visual_context.patheffects import (
    HLSModify,
    ColorMatrix as CMS,
    PathEffectsContainer,
)


def test():
    df_peng = sns.load_dataset("penguins")

    # registry of path_effects
    registry = dict(
        bright=[HLSModify(l="-50%")],
        bright_gray=[HLSModify(l="-50%") | CMS("grayscale")],
    )

    fig, axl = plt.subplots(1, 3, figsize=(11, 3), constrained_layout=True, clear=True)

    ax = axl[0]
    sns.countplot(y="species", data=df_peng, ax=ax)

    # second axes; with brighter color, oe directly from the registry
    ax = axl[1]
    sns.countplot(y="species", data=df_peng, ax=ax)

    pe = registry["bright"]

    for p in ax.patches[:2]:
        p.set_path_effects(pe)

    # second axes; with brighter+gray color, using the pe container.
    ax = axl[2]
    sns.countplot(y="species", data=df_peng, ax=ax)

    pe = PathEffectsContainer(registry)

    for p in ax.patches[:2]:
        p.set_path_effects(pe)

    pe.use("bright_gray")

    plt.show()


if __name__ == '__main__':
    test()
Total running time of the script: (0 minutes 0.207 seconds)