Note
Go to the end to download the full example code
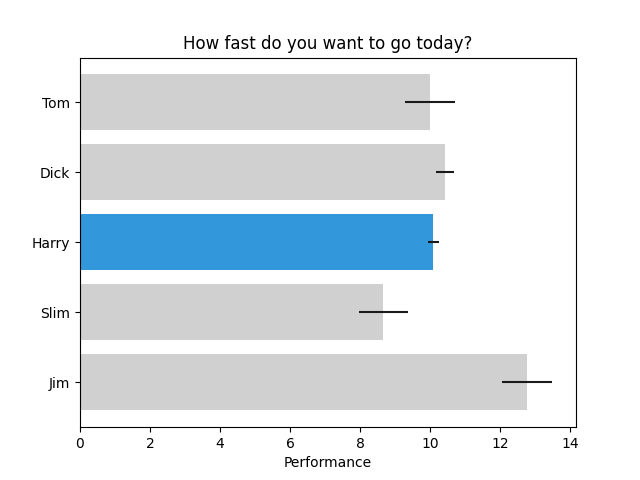
Horizontal bar chart
This example is based on barh.py example from matplotlib.
import matplotlib.pyplot as plt
import numpy as np

# Fixing random state for reproducibility
np.random.seed(19680801)

fig, ax = plt.subplots()

# Example data
people = ('Tom', 'Dick', 'Harry', 'Slim', 'Jim')
y_pos = np.arange(len(people))
performance = 3 + 10 * np.random.rand(len(people))
error = np.random.rand(len(people))

bars = ax.barh(y_pos, performance, xerr=error, align='center')
ax.set_yticks(y_pos, labels=people)
ax.invert_yaxis()  # labels read top-to-bottom
ax.set_xlabel('Performance')
ax.set_title('How fast do you want to go today?')

# Now we pick Harry's bar and change its luminosity at 50 20%, and set
# luminosity of others at 80%.
from mpl_visual_context.patheffects import HLSModify, ColorMatrix

pe_active = HLSModify(l="-80%")
pe_inactive = HLSModify(l="-30%") | ColorMatrix("grayscale")

for name, p in zip(people, bars.patches):
    if name == "Harry":
        p.set_path_effects([pe_active])
    else:
        p.set_path_effects([pe_inactive])

# The plot also shows errorbar for each bar plot. The errorbar is represented
# as a line_collection, and it is not straight forward to apply path_effects
# only to the part of them. So, it it not attempted in this example.

plt.show()
Total running time of the script: (0 minutes 0.118 seconds)