Note
Go to the end to download the full example code
ClipRect demo
Adopted from seaborn’s timeseries_facets example
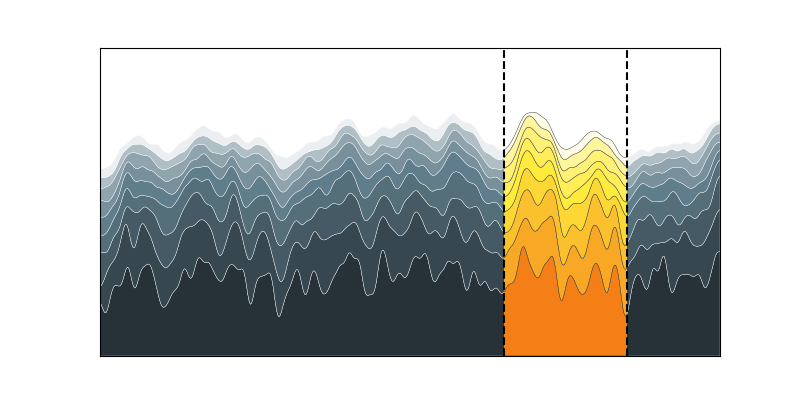
# base on stacked-plots.py from Scientific Visualisation by N. P. Rougier

import itertools
import numpy as np
import matplotlib.pyplot as plt
from scipy.ndimage import gaussian_filter1d

from mpl_visual_context.patheffects import ClipRect
from mpl_visual_context.patheffects import StrokeColor, FillColor

from SecretColors import Palette

# from mpl_visual_context.patheffects import HLSaxb, ColorMatrix

np.random.seed(1)
fig, ax = plt.subplots(figsize=(8, 4), num=1, clear=True)

X = np.linspace(0, 1, 500)

Y0 = np.ones(len(X))

pe_clip = ClipRect(ax, left=X[325], right=X[424], coords="data")

material = Palette("material")

# [90, 80, ..., 10, 5]
shades = itertools.chain(range(90, 10, -10), [5])

for i, shade in enumerate(shades):
    Y = Y0 + np.random.uniform(0, 1 / (i + 1), len(X))
    Y = gaussian_filter1d(Y, 3)

    fc1 = material.get("yellow", shade=shade)
    fc2 = material.get("blue-gray", shade=shade)
    ax.fill_between(
        X,
        Y,
        Y0,
        edgecolor="black",
        linewidth=0.25,
        facecolor=fc1,
        # we first fill the path with fc2. Then we fill with original color byt
        # with ClipRect applied.
        path_effects = [FillColor(fc2) | StrokeColor("w"), pe_clip]
    )
    Y0 = Y

ax.axvline(X[325], color="black", linestyle="--")
ax.axvline(X[424], color="black", linestyle="--")

ax.set_xlim(0, 1)
ax.set_xticks([])

ax.set_ylim(1, 3)
ax.set_yticks([])

plt.show()
Total running time of the script: (0 minutes 0.132 seconds)