Note
Go to the end to download the full example code
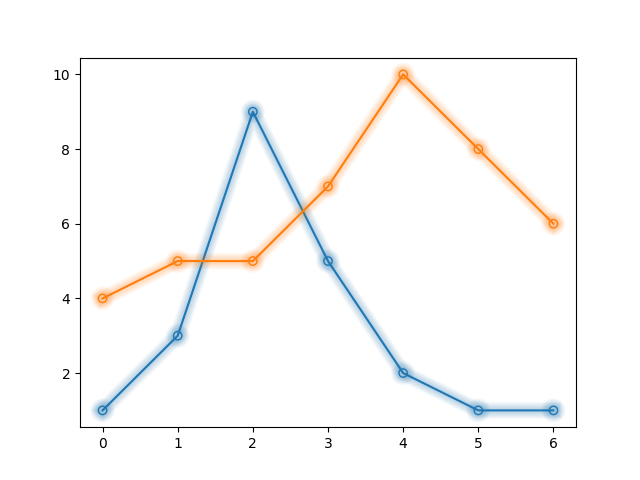
Glow
import matplotlib.pyplot as plt

from mpl_visual_context.patheffects import Glow, StrokeOnly

fig, ax = plt.subplots(num=1, clear=True)

y1 = [1, 3, 9, 5, 2, 1, 1]
y2 = [4, 5, 5, 7, 10, 8, 6]
(l1,) = ax.plot(y1, marker='o')
(l2,) = ax.plot(y2, marker='o')

for l in [l1, l2]:
    l.set_path_effects([Glow(), StrokeOnly()])

plt.show()
Total running time of the script: (0 minutes 0.148 seconds)