Note
Go to the end to download the full example code.
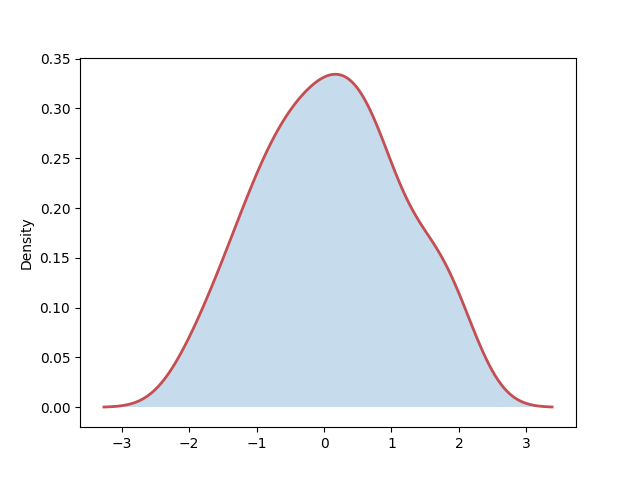
Test PathEffects
import pandas as pd
import numpy as np
import matplotlib.pyplot as plt
import matplotlib as mpl
import seaborn as sns

# Create the data : copied from examples/kde_ridgeplot.py
rs = np.random.RandomState(1979)
x = rs.randn(100)


fig, ax = plt.subplots(1, 1, num=1, clear=True)

sns.kdeplot(x, fill=True, lw=2, ec="r")

ax.set_ylim(ymin=-0.02)

from mpl_visual_context.patheffects import Partial, Open

p = ax.collections[0]

# The 1st half of the path is the bottom line, thus we only strke the 2nd half,
# and do not close the path.
p.set_path_effects([Partial(0.5, 1.0) | Open()])

plt.show()
Total running time of the script: (0 minutes 0.091 seconds)