Note
Go to the end to download the full example code.
PathEffect approach to test-polar.py
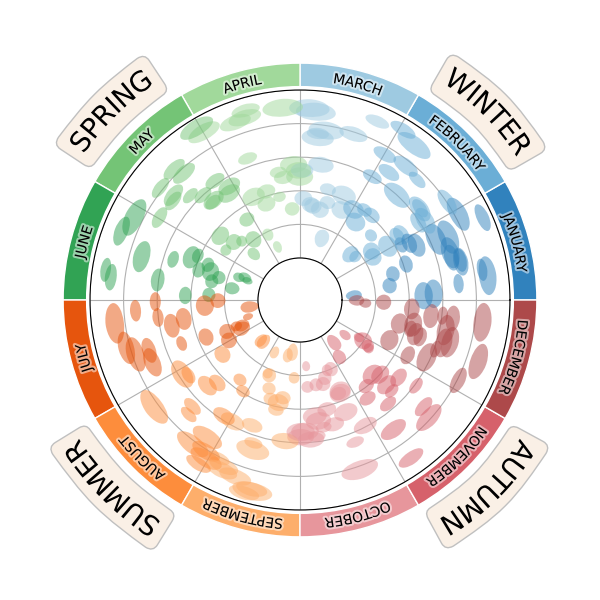
# Modified from text_polar of Scientific Visualisation book.
from mpl_visual_context.patheffects_base import GCModify
import numpy as np
import matplotlib.pyplot as plt
from matplotlib.patches import Ellipse

# Unlike the original code, we will only create a sinlge polar axes, as we will
# use patheffects which is insensitive of underlying coordinate.

fig = plt.figure(num=1, figsize=(6, 6))

size = 0.1
vals = np.ones(12)
np.random.seed(123)

# A nice set of colors for seasons
cmap20c = plt.get_cmap("tab20c")
cmap20b = plt.get_cmap("tab20b")
colors = [
    cmap20c(0),
    cmap20c(1),
    cmap20c(2),  # Winter
    cmap20c(10),
    cmap20c(9),
    cmap20c(8),  # Spring
    cmap20c(4),
    cmap20c(5),
    cmap20c(6),  # Summer
    cmap20b(15),
    cmap20b(14),
    cmap20b(13),
]  # Autumn

# Add a polar projection on top of the previous one
ax = fig.add_axes([0.15, 0.15, 0.7, 0.7], projection="polar")

# Some ellipses that will enforce polar projection
for i in range(250):
    p = np.random.uniform(0, 2 * np.pi), np.random.uniform(0.05, 0.95)
    w = h = 0.01 + 0.05 * np.random.uniform(1, 2)
    color = colors[int(np.floor((p[0] / (2 * np.pi)) * 12))]
    ellipse = Ellipse(
        p,
        width=2 * w,
        height=h,
        zorder=10,
        facecolor=color,
        edgecolor="none",
        alpha=0.5,
    )
    ax.add_artist(ellipse)

ax.set_xlim(0, 2 * np.pi)
ax.set_xticks(np.linspace(0, 2 * np.pi, 12, endpoint=False))
ax.set_xticklabels([])
ax.set_ylim(0, 1)
ax.set_yticks(np.linspace(0, 1, 6))
ax.set_yticklabels([])
ax.set_rorigin(-0.25)

month_names = [
    "JANUARY",
    "FEBRUARY",
    "MARCH",

    "APRIL",
    "MAY",
    "JUNE",

    "JULY",
    "AUGUST",
    "SEPTEMBER",

    "OCTOBER",
    "NOVEMBER",
    "DECEMBER"
]

# The original code used a pie chart, but will will use bar method since we are
# working in the polar projection. We will also add text with proper rotation.
text_months = []
for i, (n, c) in enumerate(zip(month_names, colors)):
    theta = (i+0.5)*np.pi/6
    bars = ax.bar(theta, 0.14, width=np.pi/6., bottom=1.02,
                  clip_on=False,
                  color=c, ec="w")
    t = ax.text(theta, 1.08, n, ha="center", va="center",
            rotation=(theta/np.pi*180 - 90))
    text_months.append(t)

# Add season names with larger font size.
season_names = [
    "WINTER",
    "SPRING",
    "SUMMER",
    "AUTUMN"
]

text_seasons = []
for i, n in enumerate(season_names):
    theta = (i+0.5)*np.pi/2
    t = ax.text(theta, 1.3, n, ha="center", va="baseline",
                rotation=(theta/np.pi*180 - 90), size=20,
                rotation_mode="anchor",
                bbox=dict(boxstyle="round", ec="silver", fc="linen"))
    text_seasons.append(t)

# Now we will use patheffect to curve the texts. Note that if the R parameter
# of TextAlongArc is None, R will be determined by its distance to the origin.
# We will use Recenter to temporarily make (0, 0) in polar coordinate as a
# origin.
from mpl_visual_context.patheffects import Recenter, GCModify, StrokeColor
from mpl_visual_context.patheffects_path import TextAlongArc

recenter = Recenter(ax, 0, 0)

pe_curve = recenter | TextAlongArc(None) | recenter.restore()
pe = [pe_curve | GCModify(linewidth=3, alpha=0.5) | StrokeColor("w"),
      pe_curve]
for t in text_months:
    t.set_path_effects(pe)

pe_curve2 = (recenter |
             TextAlongArc(None, smooth_line=True) |
             recenter.restore())

for t in text_seasons:
    t.set_path_effects([pe_curve2])
    t.get_bbox_patch().set_path_effects([pe_curve2])

plt.show()
Total running time of the script: (0 minutes 0.202 seconds)