Note
Go to the end to download the full example code.
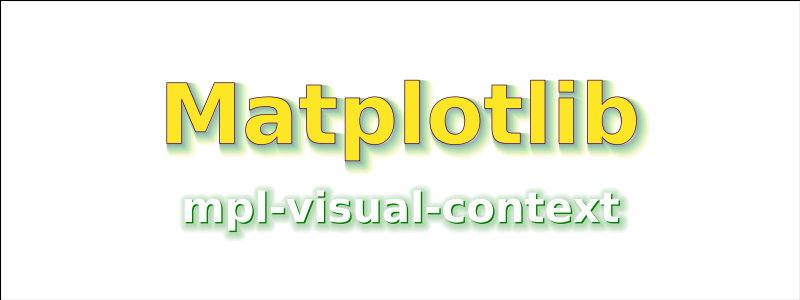
Text w/ PathEffects
# from the book

import numpy as np
import matplotlib.pyplot as plt

fig = plt.figure(figsize=(8, 3))
ax = fig.add_axes([0, 0, 1, 1], frameon=True)
# family = "Pacifico"
text = "Matplotlib"

t1 = ax.text(
    0.5,
    0.6,
    "Matplotlib",
    size=60,
    color="green",
    weight="bold",
    va="center",
    ha="center",
)

t2 = ax.text(
    0.5,
    0.3,
    "mpl-visual-context",
    size=30,
    color="green",
    weight="bold",
    va="center",
    ha="center",
)

from matplotlib.patheffects import Normal
from mpl_visual_context.patheffects import GCModify, Offset, FillColor
from mpl_visual_context.patheffects import Glow, CmapGlow

cmap = plt.cm.viridis
# cmap = plt.cm.magma

pe1 = [
    CmapGlow(cmap, diff_linewidth=10, alpha_line=1, xoffset=5, yoffset=-5),
    GCModify(foreground=cmap(0.0), linewidth=0.5) | FillColor(cmap(1.0)),
]

pe2 = [
    Offset(2, -2) | Glow(diff_linewidth=1.2),
    Offset(1, -1),
    FillColor("white"),
]


t1.set_path_effects(pe1)
t2.set_path_effects(pe2)

plt.show()
Total running time of the script: (0 minutes 0.074 seconds)