Note
Go to the end to download the full example code.
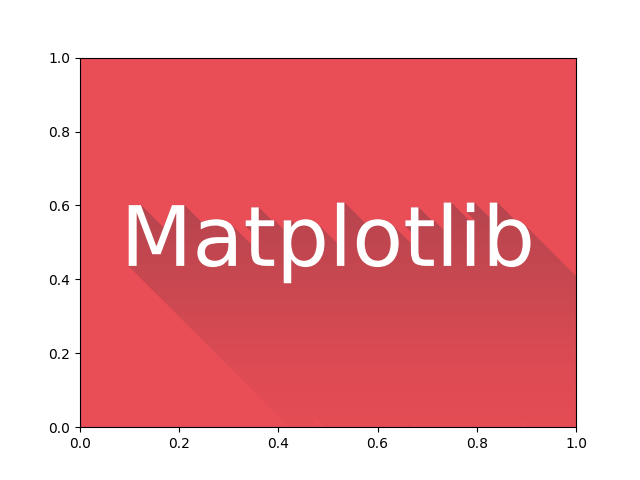
Demo with shadow path
Inspired by the example in scientific visualization book by N. P. Rougier.
import numpy as np

from matplotlib.patheffects import Normal
from mpl_visual_context.patheffects import FillColor, AlphaGradient
from mpl_visual_context.patheffects_shadow import ShadowPath

import matplotlib.pyplot as plt

red = np.array([233, 77, 85, 255]) / 255
darkred = np.array([130, 60, 71, 255]) / 255

fig, ax = plt.subplots(num=2, clear=True)
t = ax.text(0.5, 0.5, "Matplotlib", ha="center", va="center",
            size=60, color="w", clip_on=True)
t.set_path_effects([ShadowPath(45, 180) | FillColor(darkred)
                    | AlphaGradient("0 ^ 0.1 ^ 0.3 ^ 0.5"),
                    Normal(),
                    ])

ax.patch.set_fc(red)

plt.show()
Total running time of the script: (0 minutes 0.109 seconds)